Garbage collection in Java only works when objects are truly unreachable. If your code is still holding a reference, that object stays in memory whether you need it or not. This is how memory leaks happen.
In short programs you may never notice, but in long-running applications like web servers or microservices the effect builds up.
Memory usage grows, the garbage collector runs more often, response times slow down, and eventually the process crashes with an out-of-memory error.
Traditional Java static analysis tools also miss these issues, since they focus on syntax or style rather than object lifecycles.
Unit tests run too quickly to expose them. Even staging environments rarely run long enough to show the problem. By the time you see the impact, it is already costing you in production.
That is the kind of problem AI code review is designed to catch.
The problem: unintended object retention in Java
A common cause of a Java memory leak is unintended object retention. Even though Java has garbage collection, it cannot clean up objects if they are still referenced somewhere in the code.
I have seen this in long-running Java applications where memory use grows slowly over time until the JVM crashes. The issue was not the garbage collector, it was my code keeping references alive when they should have been released.
Unintended object retention often happens in situations like:
- Static collections that keep growing and are never cleared.
- Caches without proper eviction policies.
- Event listeners or callbacks that are registered but never removed.
- Inner classes holding hidden references to outer classes.
Avoiding these pitfalls is part of Java code best practices, but even experienced developers slip up in real-world projects.
Also read: Java Code Review Checklist
In all these cases, the garbage collector does exactly what it is supposed to do: it keeps objects that are still reachable.
The problem is that the developer no longer needs those objects, but the runtime sees them as active. This gap is what creates a slow but dangerous memory leak in Java.
Why traditional reviews don’t catch it
In my experience, these leaks rarely get caught during normal code reviews. Reviewers are focused on correctness and style, not whether an object will be retained in memory forever.
Static analyzers and automated Java reviews can detect some patterns but still miss complex cases of unintended object retention.
Unit tests almost never help either, since they run for a short time and don’t replicate the conditions of a service running for days or weeks.
The result is a memory leak that only shows up in production, when memory usage starts to climb without explanation.
DEMO: Writing leaking code on purpose
I wanted a demo that looked like a small production service, so I built multiple components, background work, and a shared event system. I wrote the code so a single, realistic mistake creates clear, observable retention.
What I did wrong, in plain terms:
Every incoming request creates a RequestContext. I cache some lightweight derived value, and then I register a listener on the global EventBus.
The listener is an anonymous inner class that references ctx. The EventBus stores listeners in a long lived list, and I never unregister the listener.
The JVM sees the listener in EventBus.listeners, the listener holds a strong reference to the enclosing RequestContext, and the payload inside RequestContext stays live.
Over time those contexts accumulate, heap usage grows, and the service hits sustained GC (Garbage Collector) pressure or OOM. This is the kind of bug that slips past both manual reviews and AI code quality checks if the tool isn’t context-aware.
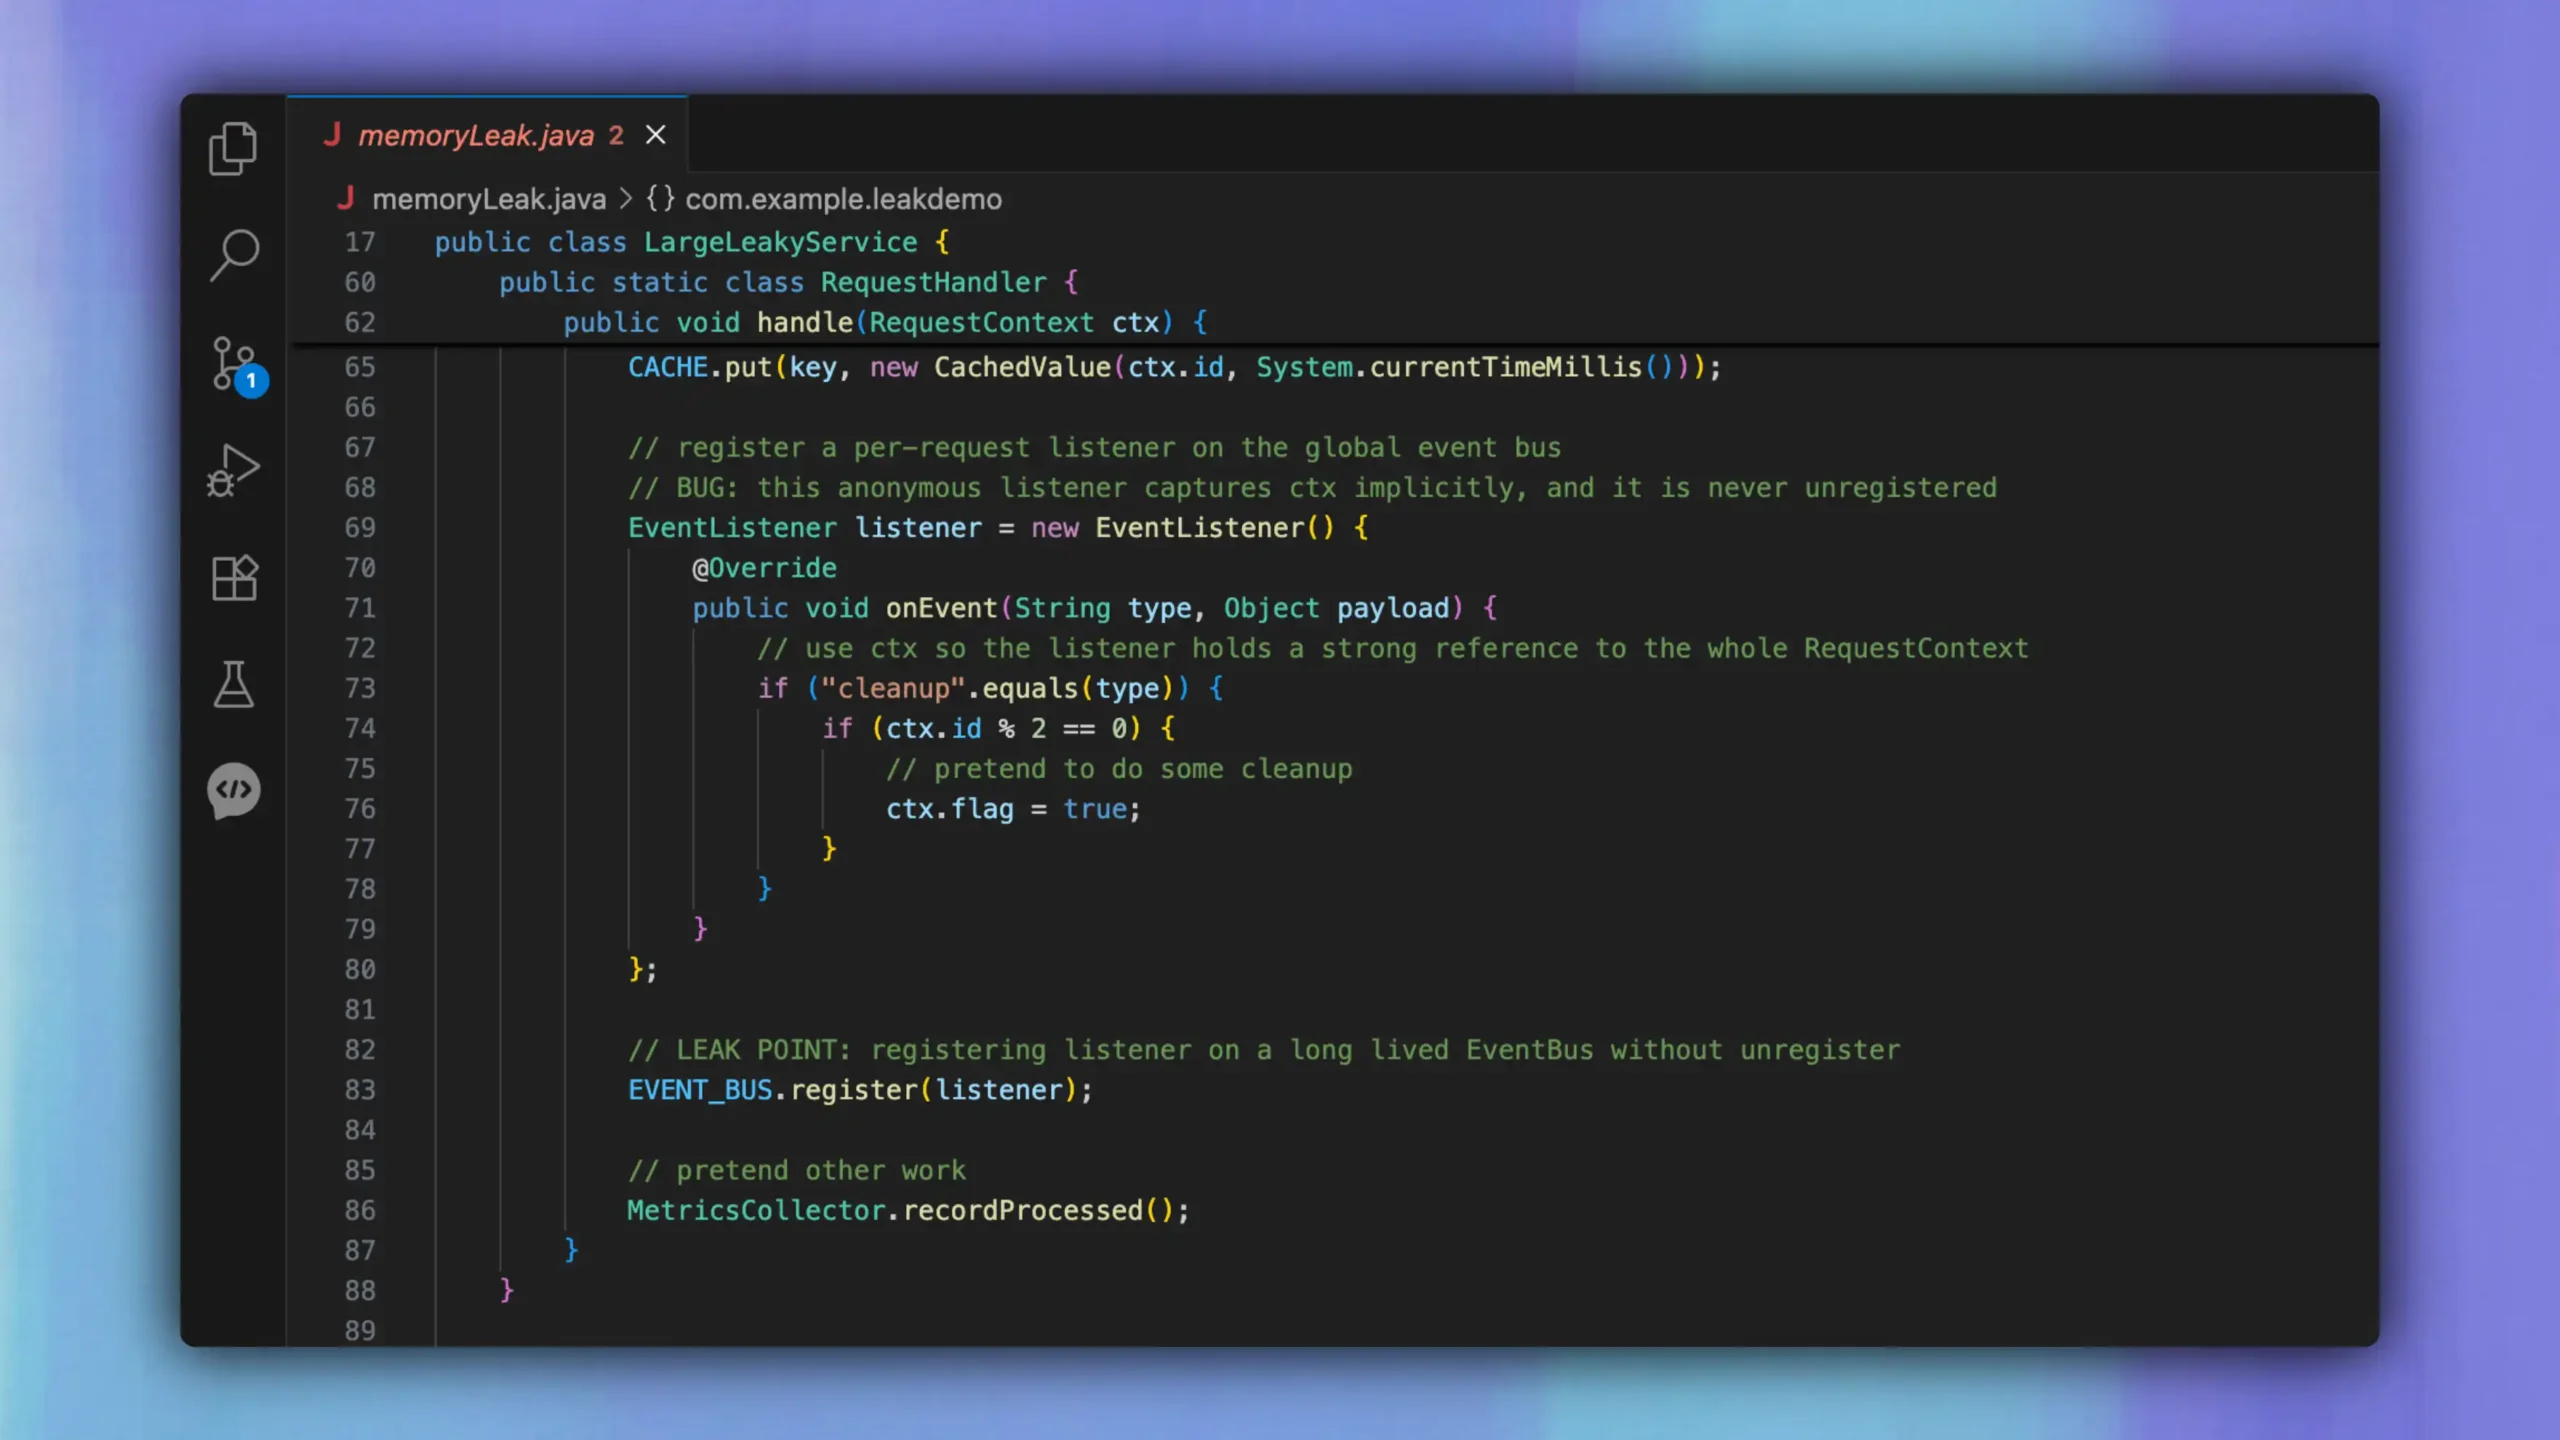
Here is the exact leak point:
EVENT_BUS.register(listener);
And here is the line that causes the listener to retain the heavy object implicitly:
EventListener listener = new EventListener() {
    @Override
    public void onEvent(String type, Object payload) {
        if ("cleanup".equals(type)) {
            if (ctx.id % 2 == 0) {
                ctx.flag = true;
            }
        }
    }
};
How Bito caught the memory leak in my PR
Once I had the memory leak code ready, I raised a pull request and asked Bito to review it. Within a few minutes, it flagged the exact problem:
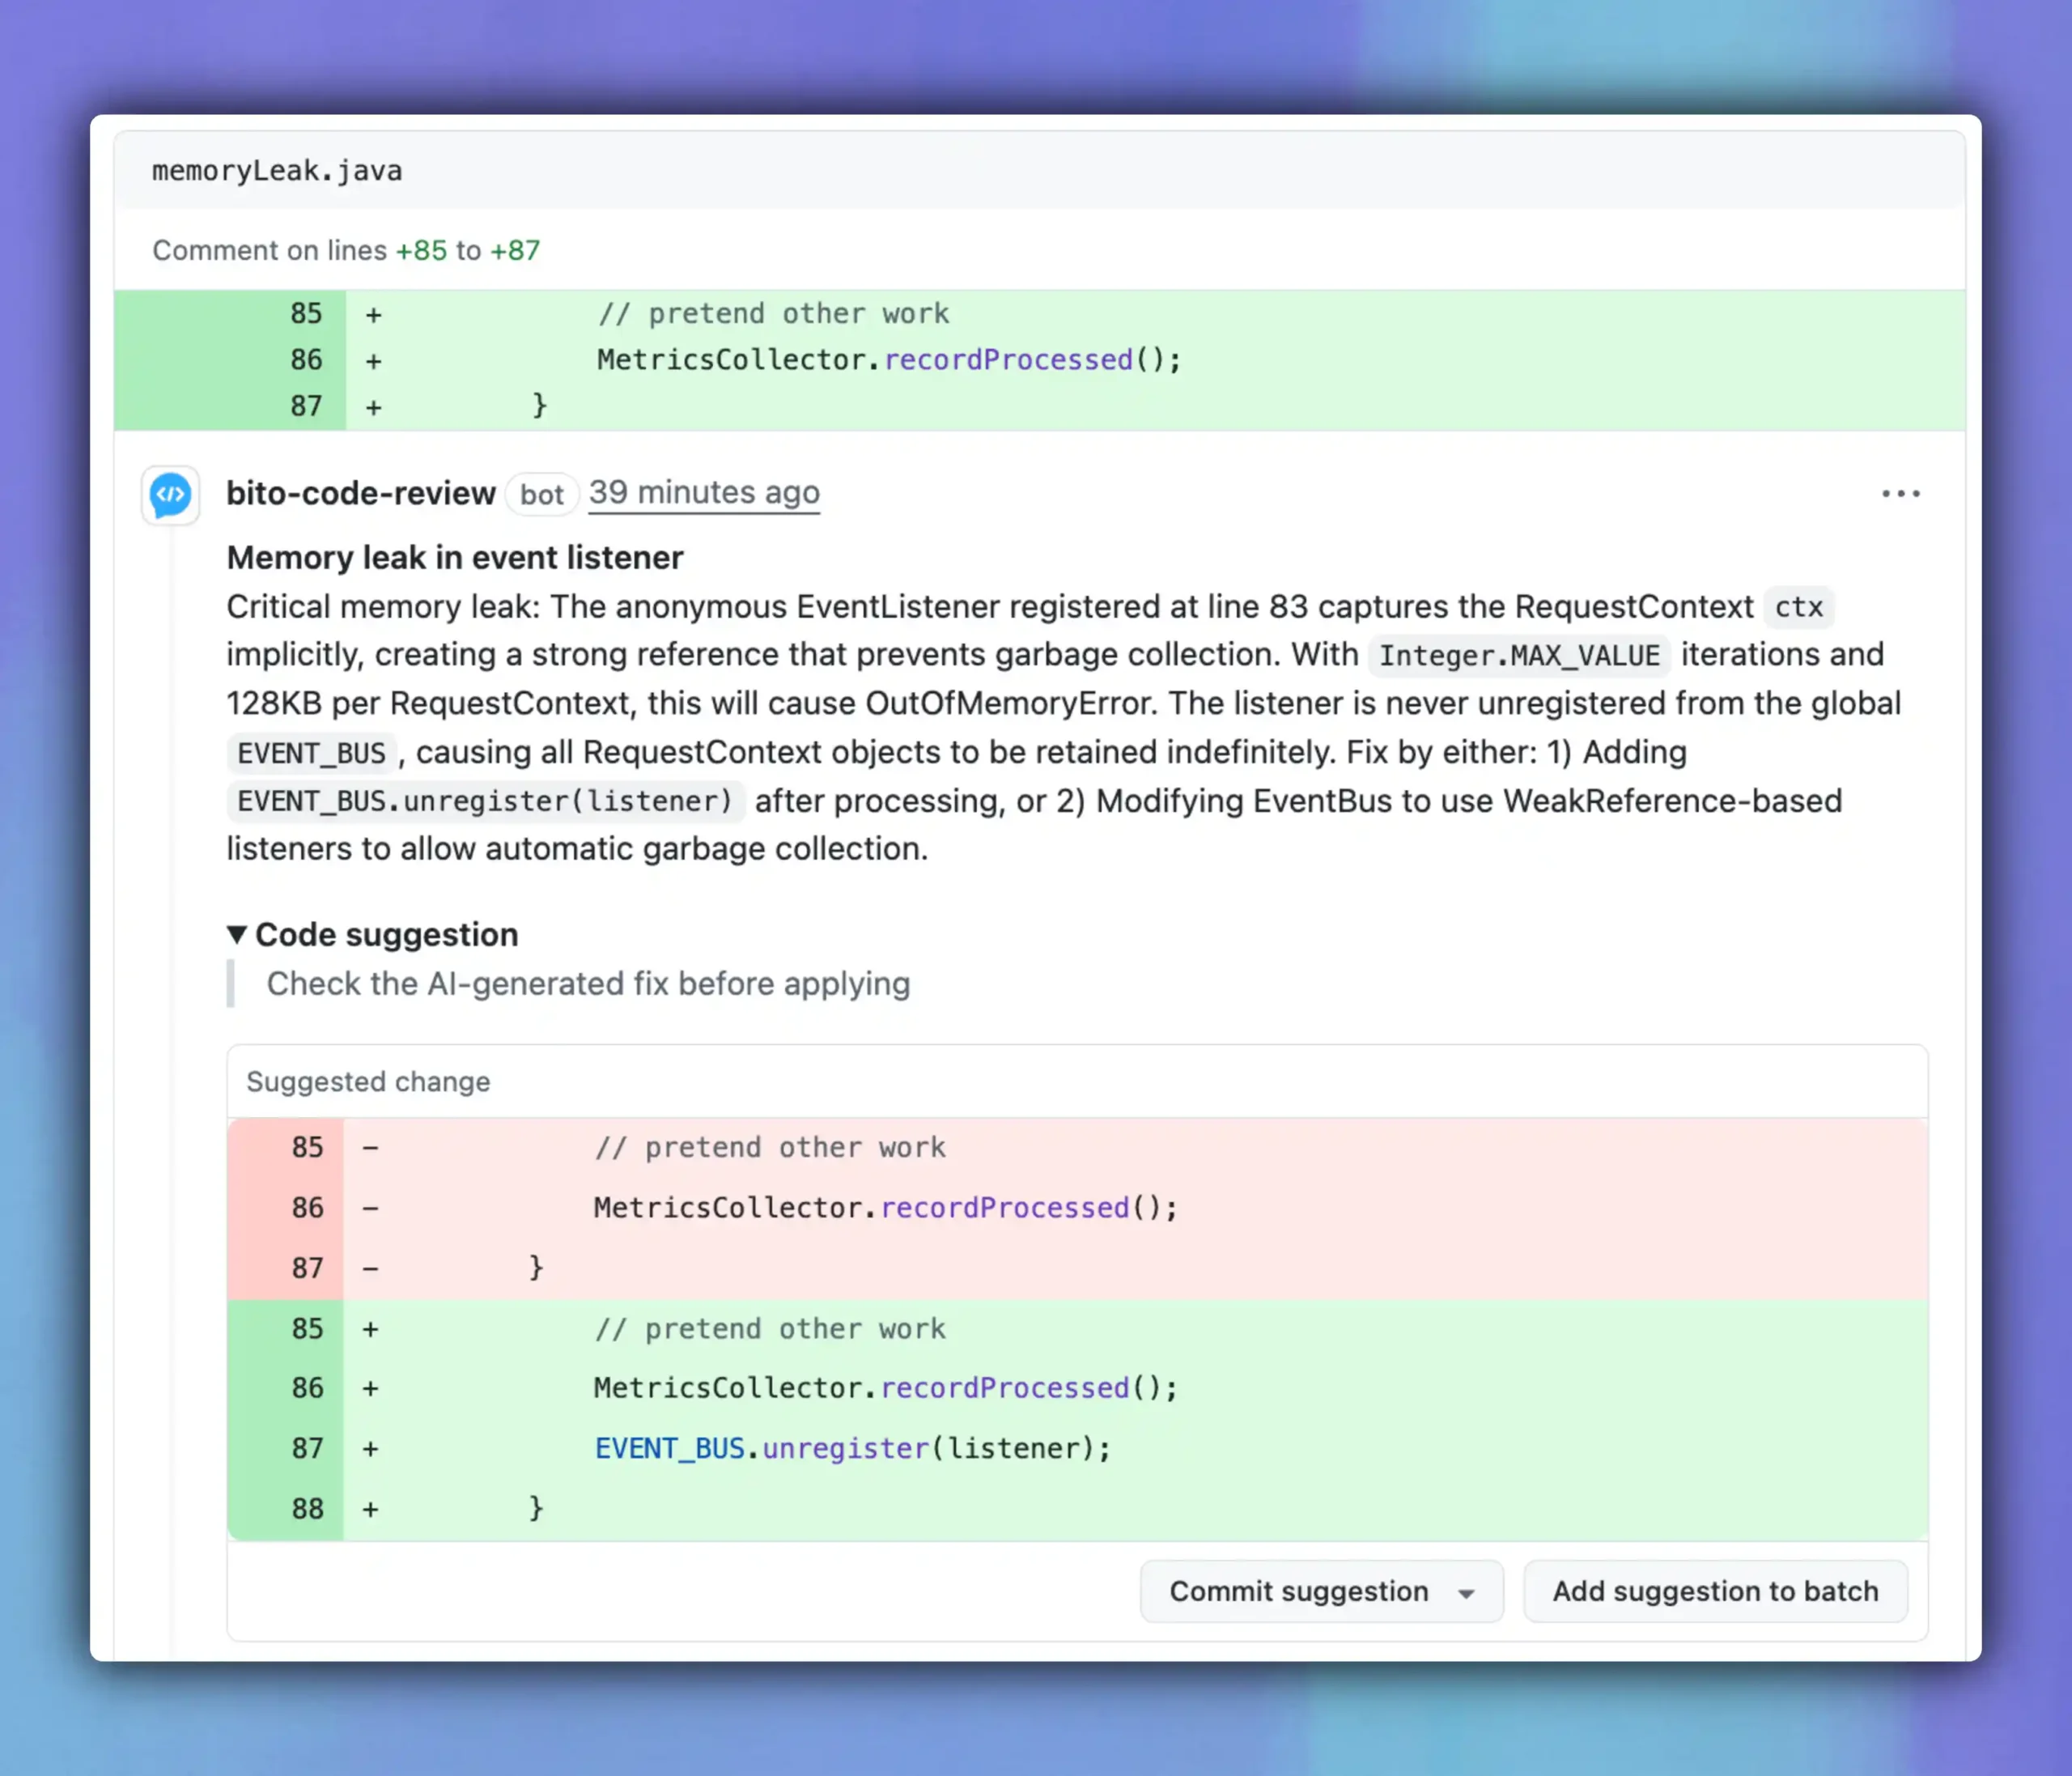
This was exactly the retention point I had planted in the code. Bito didn’t just say “there’s a leak,” it explained why the RequestContext was being held in memory, what the runtime effect would be, and two different strategies to fix it.
At this point, I had a choice: do I explicitly call unregister after each request, or do I change the EventBus to store listeners with weak references? So I decided to use the Chat with Bito’s AI Code Review Agent feature.
I asked: “What’s the trade-off between unregistering manually and using WeakReference?”
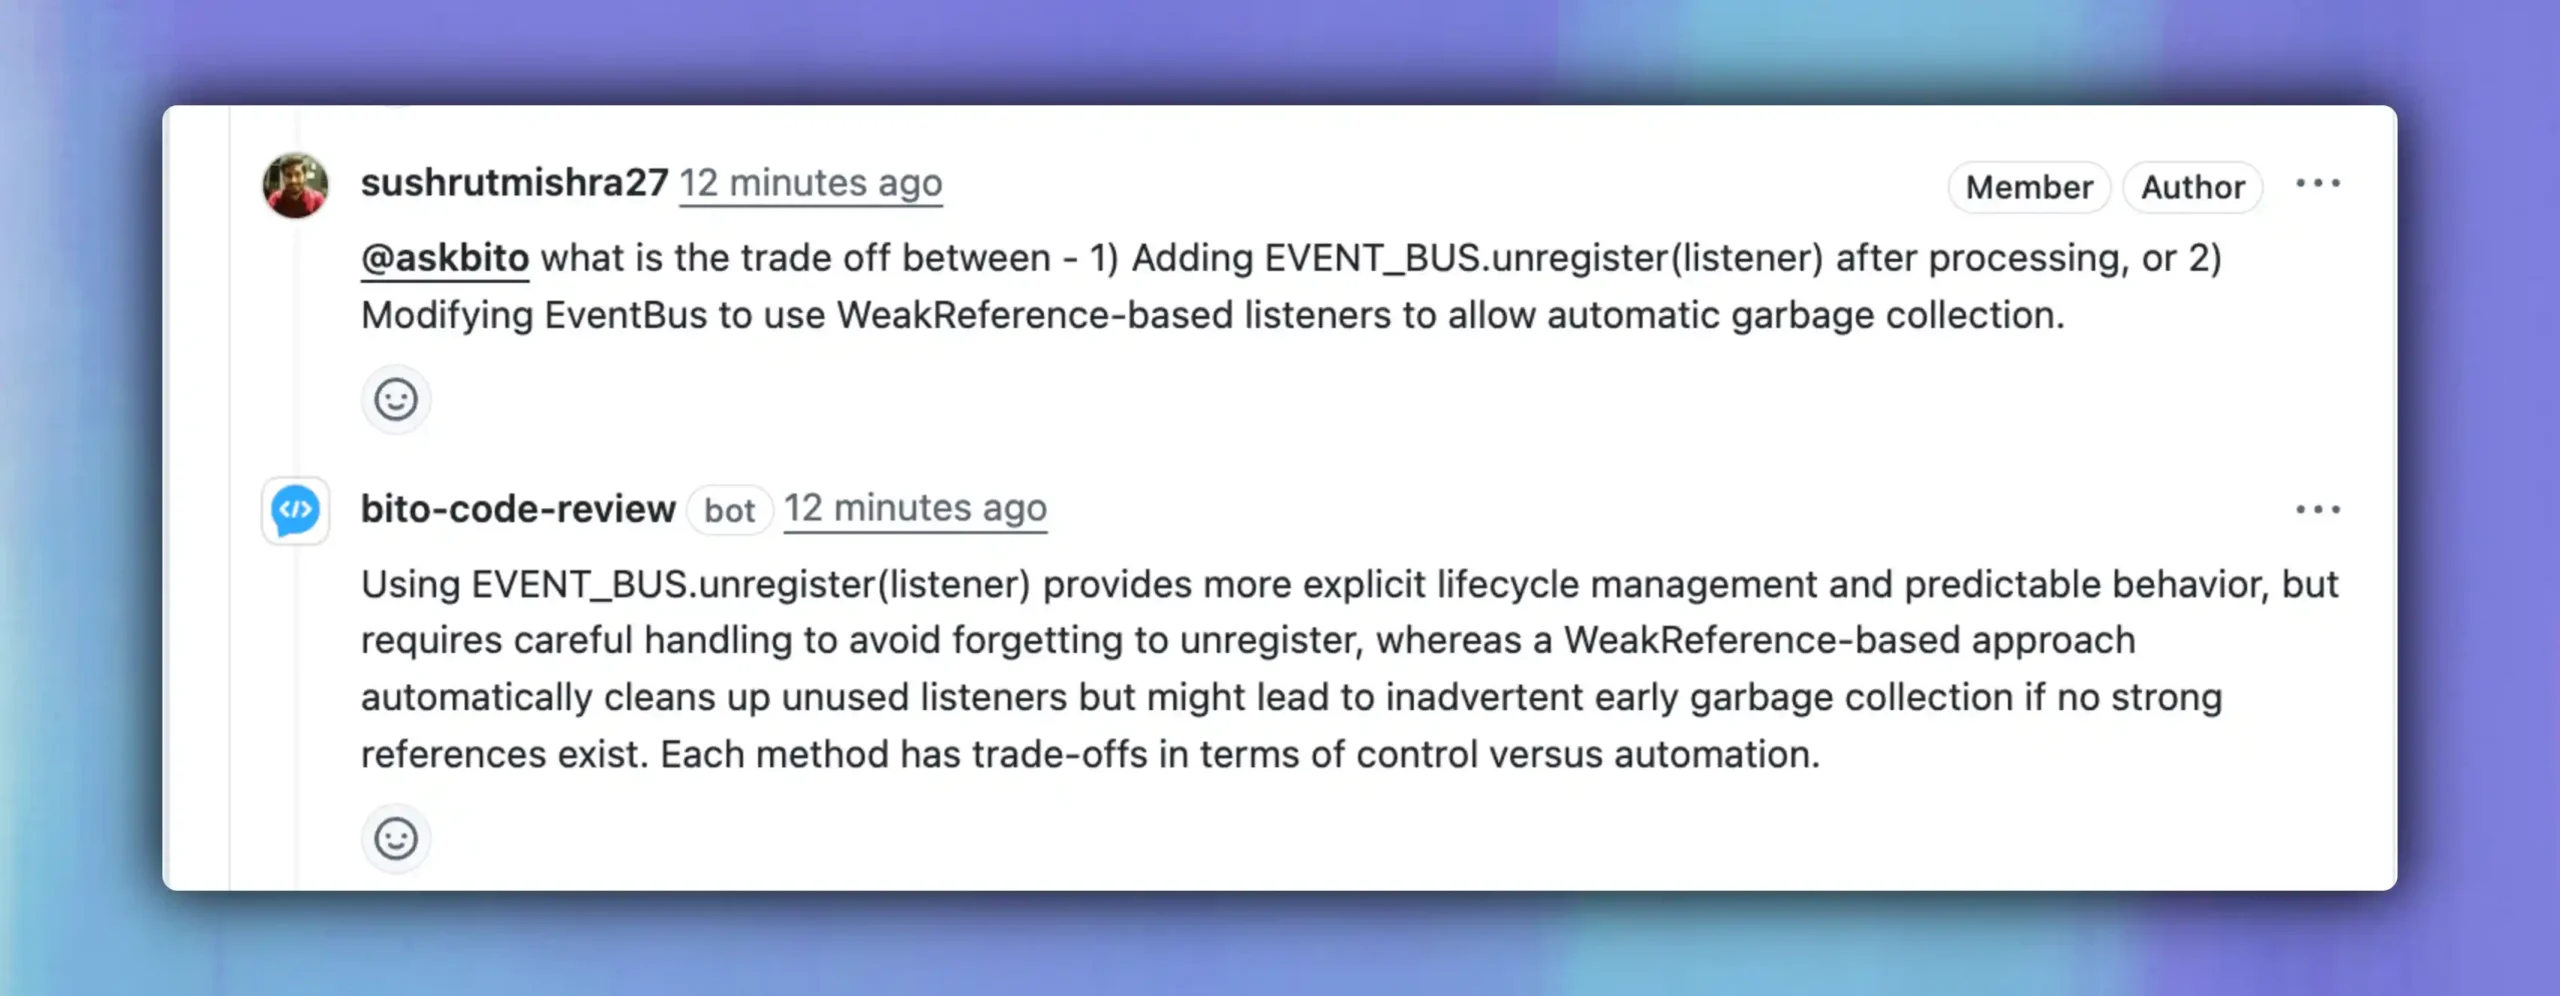
The answer made sense.
Manual unregister gives explicit lifecycle control, which is predictable but easy to forget. Weak references clean up automatically, but they risk garbage collecting a listener earlier than expected if nothing else is holding it.
Finally, I asked Bito to show me the weak reference approach in code.
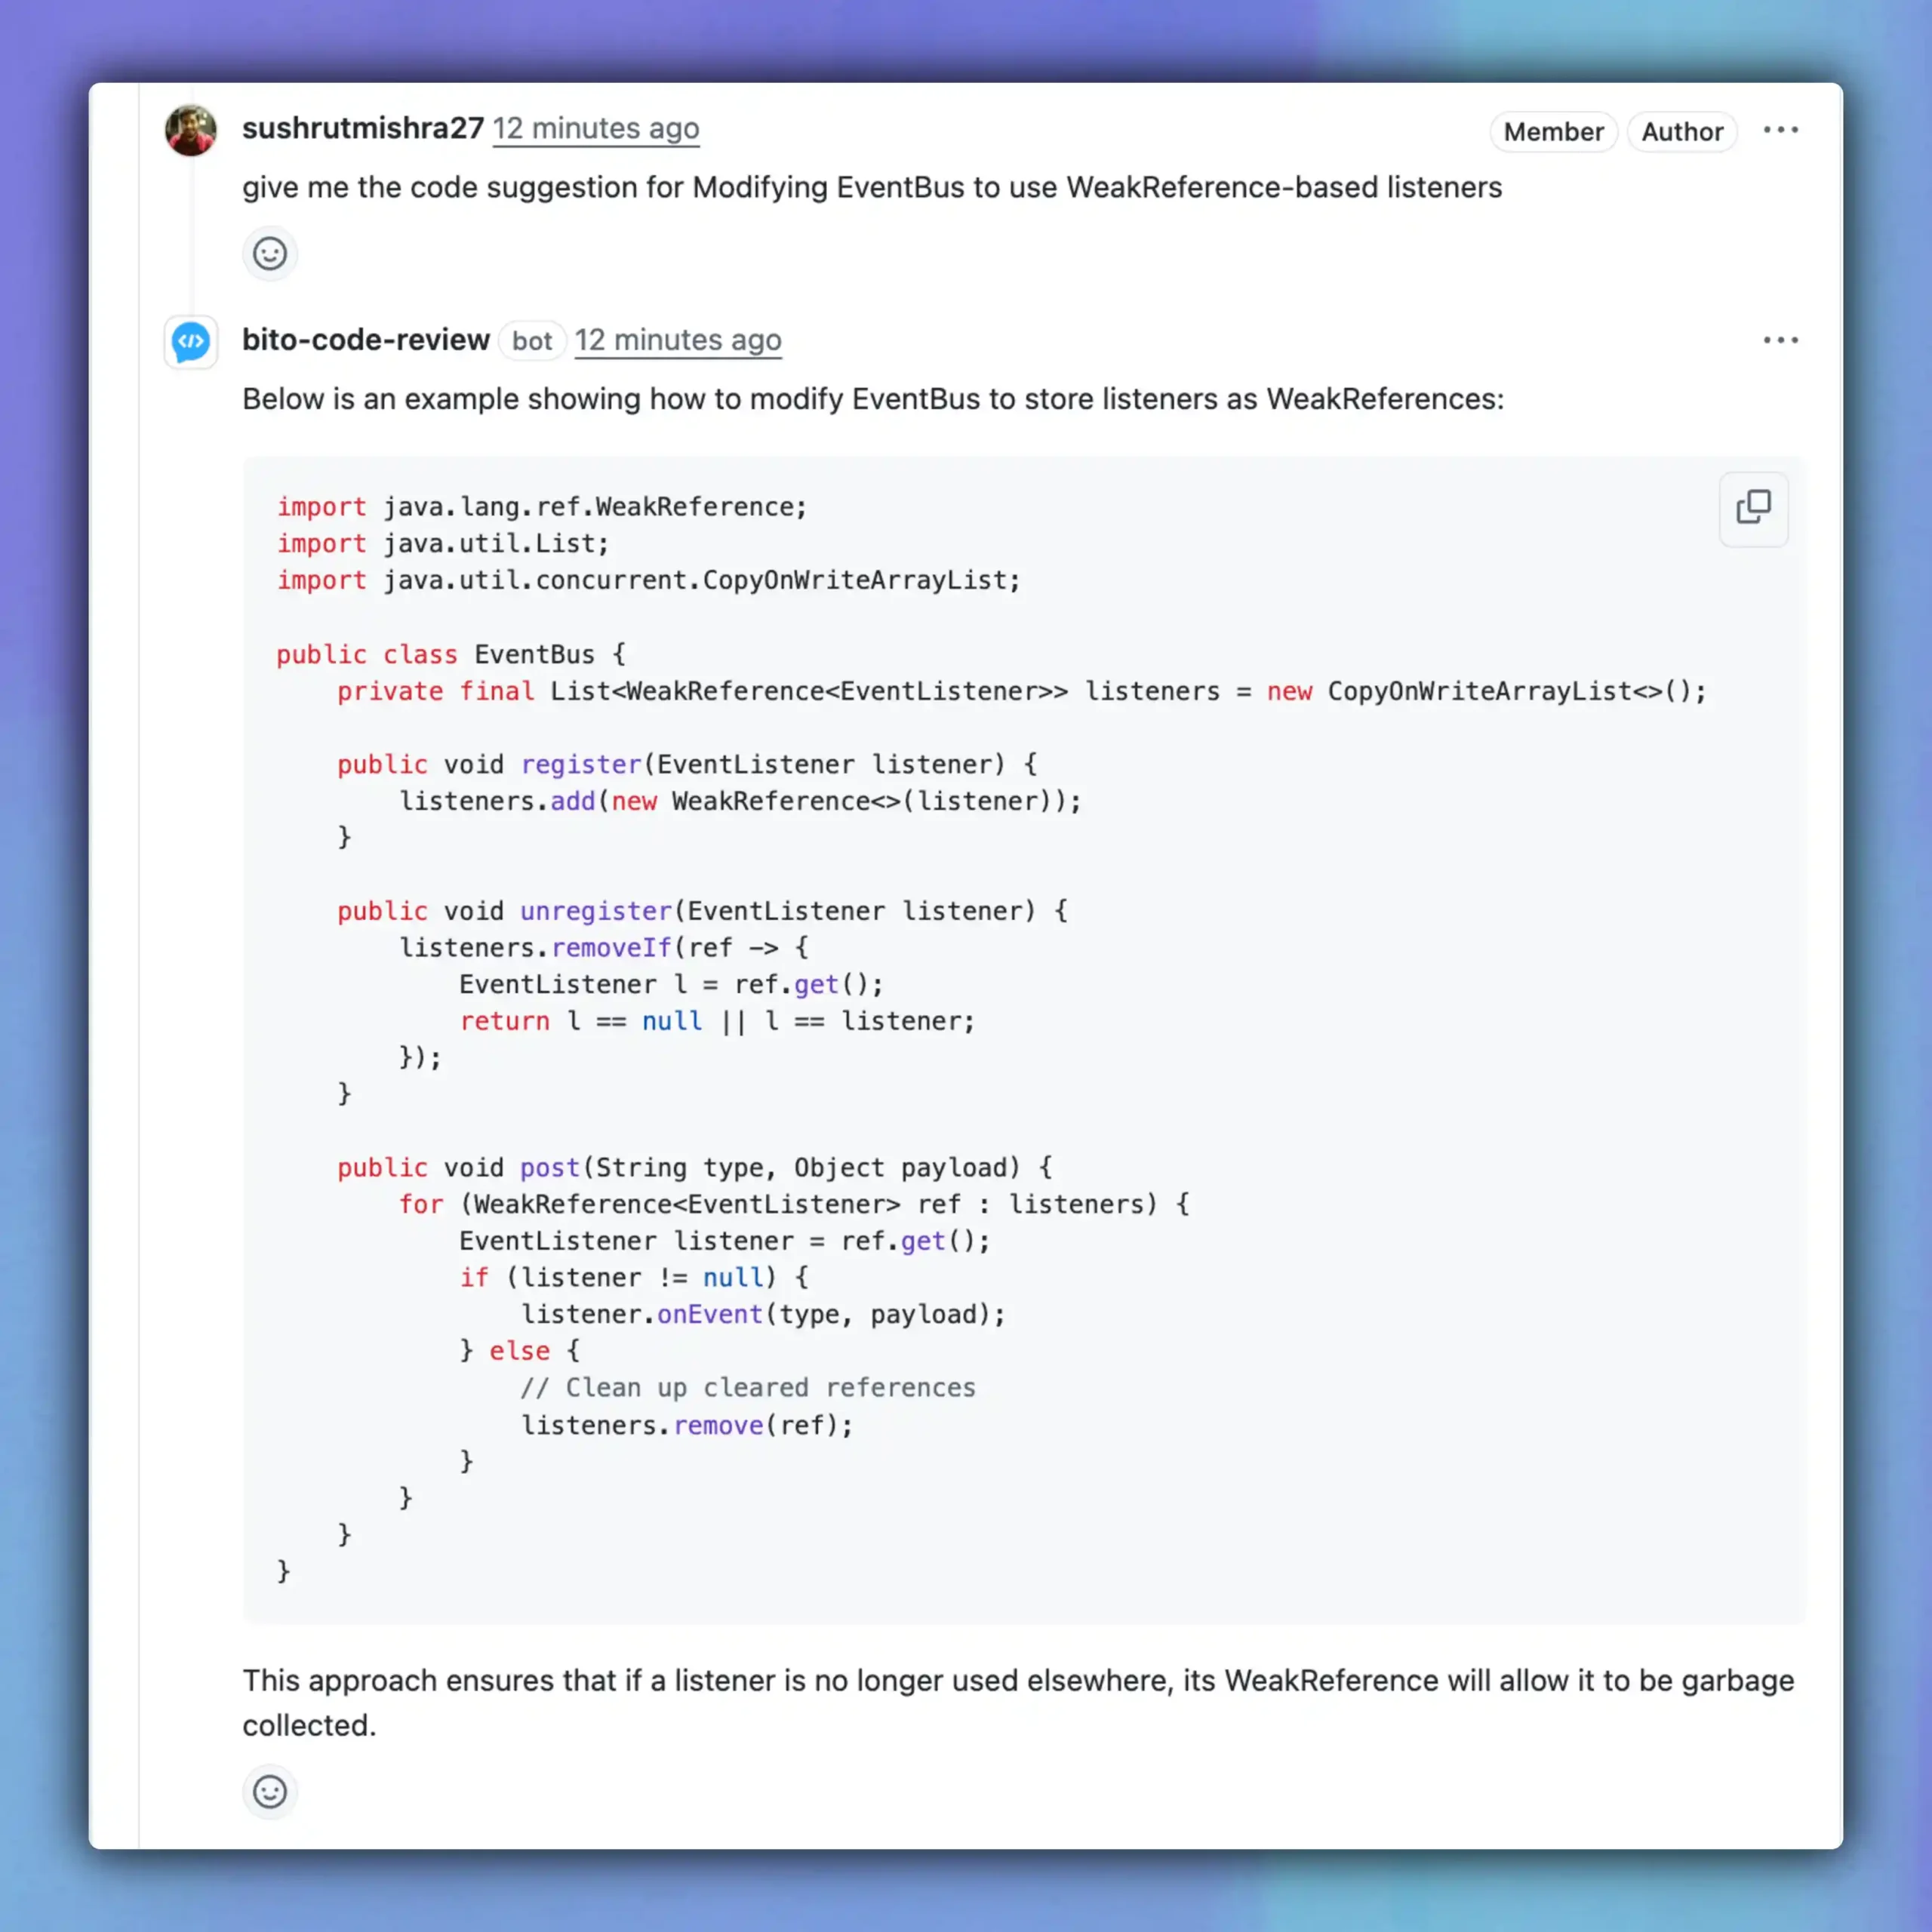
It generated a new EventBus implementation that wraps each listener in a WeakReference, removes cleared references on publish, and still lets me call unregister if I need to.
Cool, right? Bito lets me explore the options, weigh the trade-offs, and even see a working code change that addressed the leak.
What this means for my workflow
Catching this leak in a pull request showed me where AI fits into my process.
I don’t expect Bito to replace reviewers. What it does is catch the kinds of subtle bugs that humans either overlook or don’t have the patience to chase down.
Now when I open a PR, I let Bito scan the code first. If there’s a hidden issue like unintended object retention, I see it right away before anyone else spends time reviewing.
That frees my teammates to focus on design, architecture, and readability instead of digging for lifecycle bugs. It also raises the overall AI code quality of our codebase, making sure we merge clean Java code without hidden inefficiencies.
It also gives me more confidence when merging changes into a long-running service, because I know I have an extra layer of defence against memory leaks.
Conclusion
I have run into Java memory leaks when I used to work as a developer. They always appear after the service runs for a while in production, and by then they take time to track down.
With codebase-aware Bito in my PRs (also available in IDEs), I was able to catch this type of issue early. It showed me the exact line that caused the leak, explained why the garbage collector could not clean it up, and suggested a fix I could apply right away.
This is not only useful for Java. The same review process works for Python, JavaScript, Go, and other languages where subtle problems slip through code reviews.
For me, Bito works like another reviewer. It points out leaks and inefficiencies that are easy to miss, and that saves me time when merging code.